Sunday, January 31, 2016

Interfacing a B&G Zeus Touch 7 Display

I am planning the installation of a B&G Broadband 3G radar, using a Zeus Touch 7 (T7) for display. I have now received the display that will also act as a chartplotter. So it was natural for me to check if I could use the T7 Sailsteer feature, by using my own data.

It happens that the T7 has an input for NMEA0183 data. My system produces a 10 Hz stream of binary data that I have to convert to NMEA sentences supported by the display. The conversion is done by a SAMD21 32-bit microprocessor, connected to the display through a MAX3232 converter. Note that the T7 has its own internal GPS, so that I don’t need to convert and send the GPS data from my system.

Here is the schematics and wiring used. Each NMEA sentence is sent once per second, through the NMEA 0183 Talker port (orange and green wires), using a baud rate of 38400.


To test the behaviour of this setup, I used an example presented in an earlier post. I reproduce here the data from this example for convenience.


As a first test (System A of the example), I send continuously the 4 following inputs:

Heading : 0.0 deg  
Boat Speed : 6.0 knots
Apparent Wind Angle (AWA) : -26.71 deg   (-26.71 + 360 = 333.29)
Apparent Wind Speed (AWS) : 16.43 knots
     $HCHDG,0.0,,E,,W*50
     $IIVHW,,T,,M,6.0,N,,K*7D
     $WIMWV,333.29,R,16.43,N,A*1B

This corresponds to the basic inputs that the display would receive if it was directly connected to sensors (masthead unit, speed log and electronic compass). So the display is left calculating the following outputs: TWA, TWS, VMG and tide current. Here is a screen capture of the display for these conditions.


The calculated outputs of the display correspond exactly to those of the basic System A example. It is interesting to note that the display has correctly calculated a front current of 6 knots, as its GPS gives him a 0.0 knot SOG (the test is made at home, and the home does not move!).

But we know from the example that these results suffer from 2 problems: the AWA is not corrected for heeling, and the leeway is not considered. In the second test (System B), I send instead the AWA  corrected for heeling (available from my system).


Heading : 0.0 deg  
Boat Speed : 6.0 knots
Apparent Wind Angle (AWA) : -28.17 deg   (-28.17 + 360 = 331.83)
Apparent Wind Speed (AWS) : 16.43 knots
     $HCHDG,0.0,,E,,W*50
     $IIVHW,,T,,M,6.0,N,,K*7D
     $WIMWV,331.83,R,16.43,N,A*19

Here again, the values calculated by the display agree with the results of the example for System B.


In the third test (System C, corrected for leeway), I send these additional inputs correctly calculated by my system (instead of letting the T7 make these calculations):

True Wind Angle:  -45.0 deg  (-45.0 + 360 = 315.0)
True Wind speed:  12.0 knots
Wind Direction: 315.0 deg
     $WIMWV,315.0,T,12.0,N,A*11
     $WIMWD,,T,315.0,M,,N,,M*73

I cannot send the result of my VMG calculation because the VPW NMEA sentence is not supported by the T7, so that the VMG calculation is left to the display.


Here we see that the VMG value is not calculated correctly by the display. This is not surprising as the display has no information on the leeway. To do so and to reproduce all the correct data, this system would have to be completed by the B&G H5000 computer.

But despite this problem that may somewhat affect the resulting calculated laylines, I expect that the Sailsteer feature will still be very useful in practice, as it takes in account the tide current values in its calculations. This is a much more important correction in my sailing area characterized by strong tidal streams.

For now, the erroneous calculated VMG value will not be displayed on the T7, to avoid confusion with the correct value displayed on my tablet.  


Thursday, January 8, 2015

Wi-Fi revisited with the ESP8266 chip

The new ESP8266 chip has created quite a buzz in the recent months, and I have decided to give it a try for Wi-Fi communications between my instruments and a Nexus tablet. The ESP8266 is a 3 $ chip that can be programmed as a Wi-Fi access point (AP) as well as as client for a router (STA) at the same time if required. It can even host a small Web server. An SDK (Software Development Kit) is available to configure the microprocessor to specific needs.

In my case, I use it as UDP server to send the serial output generated by my system. The UDP packets are sent at the 10 Hz rate, and contain a payload of 76 bytes (mostly measured and calculated values in floating-point format). The payload contents are described here. And how the calculations are made is described here.


The Nexus tablet is programmed as a UDP client, connected to the ESP8266 AP network visible to any Wi-Fi device. When the tablet software sends a ‘START’ message to the ESP8266, it is bombarded back by the 10 Hz packets until it sends a ‘STOP’ message. These data are used to refresh the displays in real-time on the tablet. Many different custom displays can be swapped around. Any resemblance to recent professional first-class displays is not coincidental: the Android graphics capabilities are impressive.

Here is the prototype arrangement used. The ESP8266 is a 3.3V device, and a logic level converter is used on the 5 V serial signal from the system.


For development with the SDK and programming, I used this Eclipse-based tool-chain, on a Win7 64-bit machine: Espressif DevKit for Windows.


Friday, August 22, 2014

A low-cost marine compass (Part 3 – Calibration)

When connected to a terminal program through the FTDI breakout at 115200 baud, the compass displays the results formatted as NMEA sentences. This is the default operating mode (Mode 4 in the software).

Two calibration helper modes are available:
        Mode 1 : Accelerometer  calibration (type M1<ENTER>)
        Mode 2 : Magnetometer calibration (type M2<ENTER>)

These calibration modes are used to produce the raw data files required by the calibration software Magneto. In these modes, the compass stops displaying results until it receives an ‘x’ character (type x<ENTER> in the terminal program).

In Mode 1 (Accelerometer), it will then displays 64 consecutive (x,y,z) filtered raw data (at the 200 Hz rate), then pauses until it receives another ‘x’ character.


In Mode 2 (Magnetometer), it will displays 16 consecutive (x,y,z) raw data (at the 6.5 Hz rate), then pauses until it receives another ‘x’ character.


By logging the results to a text file in the terminal program, it is then possible to create the Magneto input files, by moving the compass around and pressing the ‘x’ character at each new position.

I recommend moving the compass with roughly equal angle steps around three perpendicular axis. For the accelerometer, you can use any support (metallic or not) to help position the compass, but it is very important to wait until the compass is completely at rest (no vibration) before hitting the ‘x’ character.

For the magnetometer, try to use the lightest non-magnetic support (wood or plastic), and use the ribbon cable to keep away the FTDI brekout and especially the laptop (all this in a magnetic clean environment!).

The 2 raw data files can then be processed by the Magneto software. The Pro Mini source file can then be edited with the new values and recompiled.

Unfortunately, this is not the end of the game if we want to be rigorous. We will have to look for misalignments between three independent reference frames: the compass base, the accelerometer plan and the magnetometer plan, with a final offset correction when compared to a known heading.

But the compass should already be quite usable, as these last corrections will be quite small compared to what has been accomplished.


A low-cost marine compass (Part 1 - Hardware)
A low-cost marine compass (Part 2 - Software)


Wednesday, August 20, 2014

A low-cost marine compass (Part 2 – Software)

The problem with low-cost sensors is that the accelerometer outputs are very noisy (much less so for the magnetometer).

The LSM303D sensor is one of 2 magnetic sensors supported by the PX4 development team. The solution they have chosen to reduce the noise in the accelerometer outputs is to apply a low-pass software filter to the measurements, in addition to the hardware low-pass filter built into the chip. In this project, I have ported their LSM303D SPI driver and 2-pole software filter to the WinAVR environment.

I have also kept the strategy adopted for my Hi-Res compass, which is to use a higher sampling rate for the accelerometer, and take the average result in the calculation performed after each magnetometer measurement.

I have chosen a 6.25 Hz sampling rate for the LSM303D magnetometer, to insure that it will operate in its hi-resolution mode. The accelerometer sampling rate is set at 200 Hz, and the cut-off frequency of the software low-pass filter is set at 40 Hz.

Here is a general explanation of the code behaviour during normal operation.

The Pro Mini continually reads triple raw values (x,y,z) from the accelerometer. For each axis, it feeds the raw value to the software low-pass filter, which spits out a new filtered value for each axis. The filtered values are accumulated and counted.
 
Each time the LSM303D magnetometer has a new set of 3 raw values available (x,y,z), it fires an interrupt on the Pro Mini. When this happens, the Pro Mini applies the calibration correction to the magnetometer values. It calculates the average of the accelerometer filtered values since the last interrupt, and applies the calibration correction. From this set of 6 values, it calculates the tilt-compensated heading, and the heel and pitch angles. It formats the results in 2 NMEA sentences that are sent to the serial port (115200 baud), 6.25 times per second. 


The source code for the WinAVR environment can be found here. I am using Programmer’s Notepad to compile the code and program the Pro Mini through the Arduino bootloader. 

This implies that the calibration factors have already been found since they appear as constants in the code. The software has other modes of operation useful for developing these calibration factors, which will be presented in Part 3 of this series.


A low-cost marine compass (Part 1 – Hardware
A low-cost marine compass (Part 3 - Calibration

Tuesday, August 19, 2014

A low-cost marine compass (Part 1 – Hardware)

For an electronic compass, the accuracy depends more on the quality of the calibration that on the price of the components. Here is the design of a low-cost compass developed around this idea.

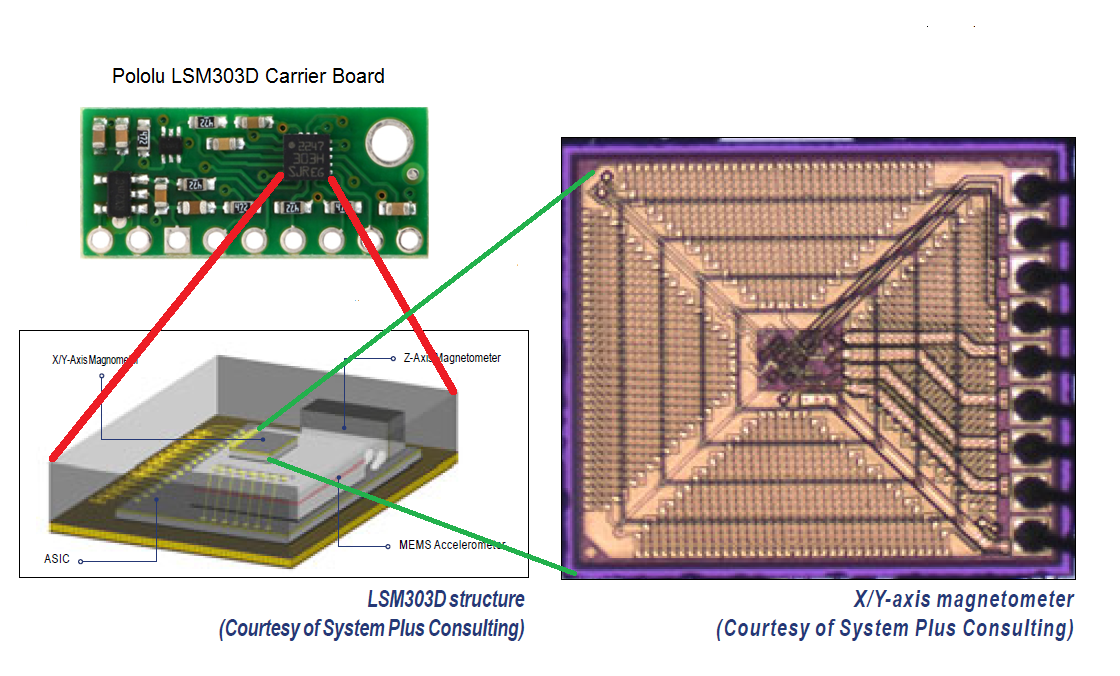
The compass is based on the LSM303D chip which combines a 3-axis accelerometer and a 3-axis magnetometer. I used the Pololu carrier board featuring this chip (9.95 US$).


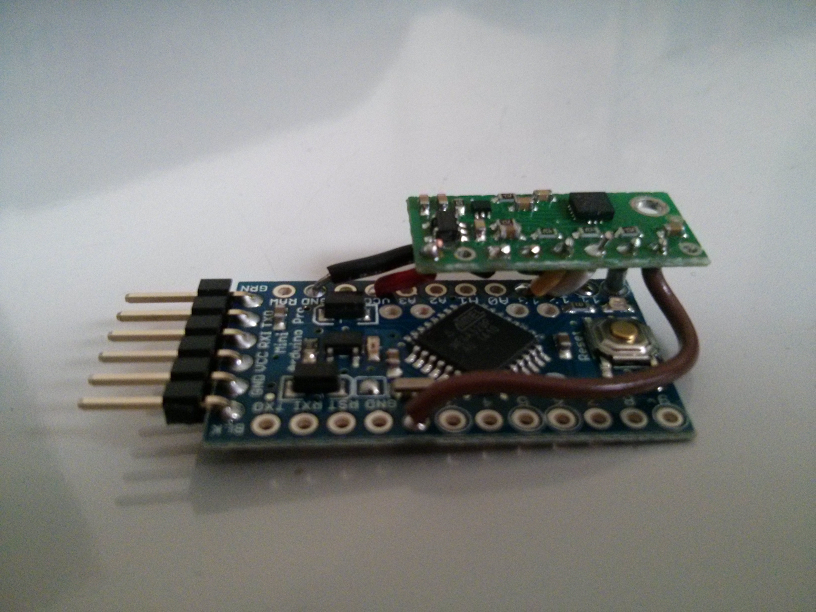
The other component of the compass is an Arduino Pro Mini 328 – 3.3V/8Mhz from Sparkfun (9.95 US$). The Pro Mini communicates with the LSM303D through the SPI bus, using drivers adapted from the PX4 Development Team. The 2 components are hardwired together to keep a compact form.


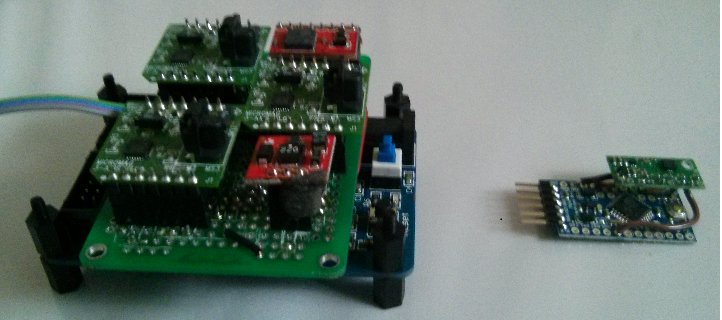
The following picture illustrates the small compass besides my Hi-Resolution custom compass previously described on this blog.


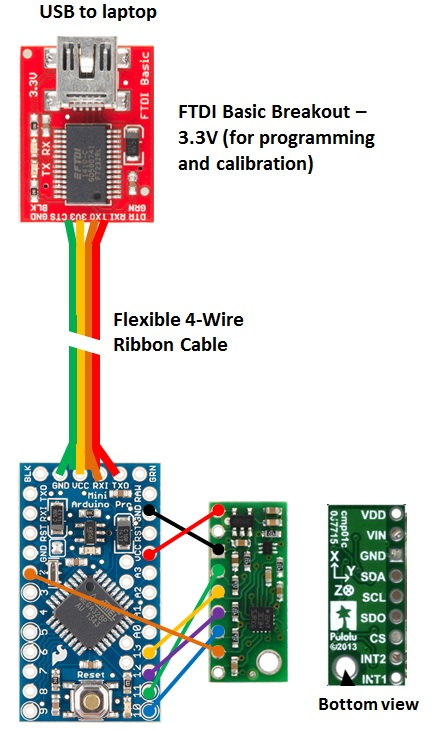
Here is the wiring diagram for SPI communication. The FTDI breakout is used to program the Pro Mini and to read the LSM303D raw data during the calibration step.


The long ribbon cable is required during calibration so that the compass can be moved around at a safe distance from the breakout and the laptop to avoid magnetic interference. After calibration, the ribbon cable is used to power the compass (3.3V) and to transmit the tilt-compensated heading and the heel angle through the serial link to whatever instrument that needs it.


A low-cost marine compass (Part 2 – Software) 
A low-cost marine compass (Part 3 - Calibration)


Wednesday, April 9, 2014

Catamaran’s Sailing Instruments

A catamaran’s owner has decided to adapt my design to his boat, which is sailed on a large freshwater lake. As the lake’s currents are virtually negligible, the boat speed is measured from a GPS. Furthermore, for a catamaran, there is no need to correct wind angle measurements for heel. No electronic compass is planned for now. A Nexus tablet is used as display, with a Bluetooth link to the system.

For a catamaran, as there is no heel, there is no way to calculate the leeway as we do for a keelboat  using boat speed and heel (as described here). So the owner will have to make test runs and physically measure the leeway in different conditions, while logging boat speed, wind speed and apparent wind angle. It is expected that the leeway angle can be correlated to these 3 variables, and that correction curves can be developed and programmed in the microcontroller. For now, the leeway corrections will be neglected until test data are available.


The microprocessor acquires or calculates the following data 10 times per second (10 Hz):
·        Apparent wind angle (AWA)
·        Apparent wind speed (AWS)
·        Boat speed through water (STW = GPS’s SOG)
·        True wind speed (TWS)
·        True wind angle (TWA)
·        Velocity Made Good (VMG)
·        Leeway angle
·        Heading ( = GPS's COG, when not corrected for leeway)
·        Wind direction


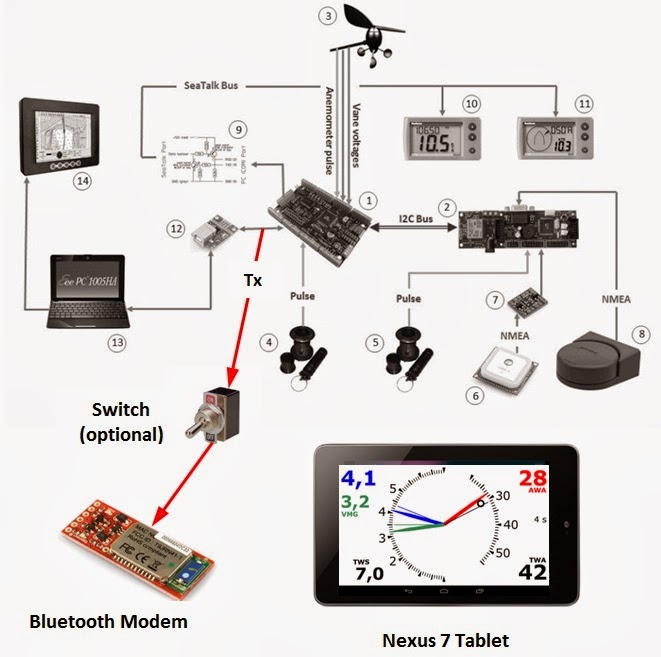
These data are available through a serial link, going both to a Bluetooth modem and to serial-to-USB converter.

The Nexus tablet calculates running averages over an adjustable range and refreshes a custom display 10 times per second.

A laptop can be connected to the system to view or change calibration values, or to download live data for further analysis.

The system is now under construction and will soon be installed. Software (both for the microprocessor and the Android tablet) is also under development. The microprocessor code under development (in the WinAVR environment) can be found here. More detailed documentation will be added at the same location.


Tuesday, January 21, 2014

Going Bluetooth with an Android Tablet

After experimenting with Wi-Fi, I have now added a Bluetooth link between my system and an Android tablet. This has proved to be very reliable, and simpler to implement when compared to Wi-Fi.


As the Bluetooth modem operates from a 5 V supply, no level shifting is required on the data line.

However, there is one constraint that has to be considered. When the tablet tries to connect to the system, the connection will fail if there is data already flowing on the serial output.

There are 2 ways to deal with this:
               - add a switch to manually cut the serial input during the connection step;
               - connect during an initial delay at the system start-up (this is how I proceed, as there is a 10 seconds delay without transmission when my system is switched on).

In my Bluetooth app, the first screen shows a ‘Connect’ button and a disabled ‘Start’ button. The 'Connect' button is pressed when there is no data coming in. Once the connection is established, the ‘Start’ button is enabled and can be pressed to initiate a new thread that decodes the modem output, and pass the information to the main instrument view that is now switched on, refreshed 10 times per second.

The Bluetooth thread also saves all data in a large memory buffer (16 MB) that can store up to 4.5 hours of data per session. When the app is closing, these data are written to a file on the tablet’s internal memory card, that can later be transferred to a PC for analysis.