Wednesday, April 9, 2014

Catamaran’s Sailing Instruments

A catamaran’s owner has decided to adapt my design to his boat, which is sailed on a large freshwater lake. As the lake’s currents are 
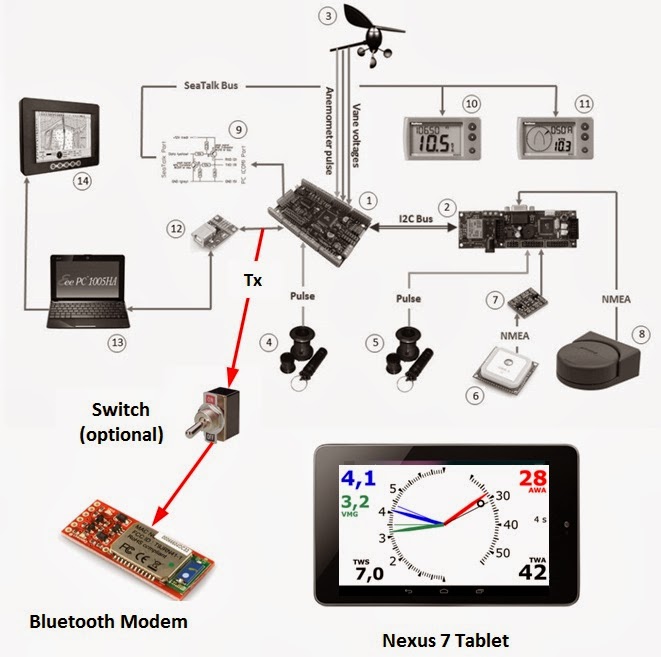
virtually negligible, the boat speed is measured from a GPS. Furthermore, for a catamaran, there is no need to correct wind angle measurements for heel. No electronic compass is planned for now. A Nexus tablet is used as display, with a Bluetooth link to the system.

For a catamaran, as there is no heel, there is no way to calculate the leeway as we do for a keelboat  using boat speed and heel (as described here). So the owner will have to make test runs and physically measure the leeway in different conditions, while logging boat speed, wind speed and apparent wind angle. It is expected that the leeway angle can be correlated to these 3 variables, and that correction curves can be developed and programmed in the microcontroller. For now, the leeway corrections will be neglected until test data are available.


The microprocessor acquires or calculates the following data 10 times per second (10 Hz):
·        Apparent wind angle (AWA)
·        Apparent wind speed (AWS)
·        Boat speed through water (STW = GPS’s SOG)
·        True wind speed (TWS)
·        True wind angle (TWA)
·        Velocity Made Good (VMG)
·        Leeway angle
·        Heading ( = GPS's COG, when not corrected for leeway)
·        Wind direction


These data are available through a serial link, going both to a Bluetooth modem and to serial-to-USB converter.

The Nexus tablet calculates running averages over an adjustable range and refreshes a custom display 10 times per second.

A laptop can be connected to the system to view or change calibration values, or to download live data for further analysis.

The system is now under construction and will soon be installed. Software (both for the microprocessor and the Android tablet) is also under development. The microprocessor code under development (in the WinAVR environment) can be found here. More detailed documentation will be added at the same location.


Tuesday, January 21, 2014

Going Bluetooth with an Android Tablet

After experimenting with Wi-Fi, I have now added a Bluetooth link between my system and an Android tablet. This has proved to be very reliable, and simpler to implement when compared to Wi-Fi.


As the Bluetooth modem operates from a 5 V supply, no level shifting is required on the data line.

However, there is one constraint that has to be considered. When the tablet tries to connect to the system, the connection will fail if there is data already flowing on the serial output.

There are 2 ways to deal with this:
               - add a switch to manually cut the serial input during the connection step;
               - connect during an initial delay at the system start-up (this is how I proceed, as there is a 10 seconds delay without transmission when my system is switched on).

In my Bluetooth app, the first screen shows a ‘Connect’ button and a disabled ‘Start’ button. The 'Connect' button is pressed when there is no data coming in. Once the connection is established, the ‘Start’ button is enabled and can be pressed to initiate a new thread that decodes the modem output, and pass the information to the main instrument view that is now switched on, refreshed 10 times per second.

The Bluetooth thread also saves all data in a large memory buffer (16 MB) that can store up to 4.5 hours of data per session. When the app is closing, these data are written to a file on the tablet’s internal memory card, that can later be transferred to a PC for analysis.

Thursday, October 17, 2013

7” Nexus Tablet as Instrument Display

I have been experimenting in building custom displays on a 7” Nexus tablet, from 10 Hz live data received through Wi-Fi from my master microcontroller. This short video taken while sailing shows how this looks like.


The Nexus tablet is powerful enough for the job, refreshing the screen 10 times per second with new data.

 This screenshot explains what is going on in close hauled mode:


There are 3 thick needles, each one accompanied with a smaller one and a corresponding number of the same color.

The blue data is for STW (Speed Through Water), the green data is for VMG (Velocity Made Good), and the red data is for AWA (Apparent Wind Angle). The small needles are the instantaneous measured values, refreshed 10 times per second. The thick needles and the corresponding numbers are dampened data (moving averages over 1 to 5 seconds, recalculated 10 times per second by the tablet). The damping period (4 s in this screenshot) is adjustable on the fly by sweeping a finger on the tablet up and down.

The small black circle is a moving target (depending on current True Wind Speed), which represents the optimal AWA for best VMG.

The next screenshot is for downwind mode. Here, the red needle represents TWA (True Wind Angle), a more useful information when flying the asymmetrical spinnaker.


There is also a night mode available, created by inverting the black and white colors.


The tablet is not bright enough to be used as a fixed display in the cockpit, but very usable as a personal display, like the tacticians in the last America Cup.
 
Ben Ainslie (Oracle Team)
 
 
Ray Davies (Team New Zealand)


Wednesday, November 28, 2012

GPS data from Wifly to Android phone (Part 2)

As a proof of concept, I have created a simple app that fetches the last UDP packet received, and displays its contents in a floating message box, each time the button is pressed.


Here is an excerpt of the app's java code that is used for that.

...
public class MainActivity extends Activity {
   ...
   public void sendMessage(View view) {
        new ServerAsyncTask(MainActivity.this).execute();
   }
   ...
   public static class ServerAsyncTask
               extends AsyncTask<Void, String, Void> {
      private Activity act;
      public ServerAsyncTask(Activity _act) {
           this.act = _act;
      }
      @Override
      protected String doInBackground(Void... params) {
         byte[] receiveData = new byte[1024];
         DatagramSocket socket = null;
         try {
            socket = new DatagramSocket(50000);
            socket.setSoTimeout(30000);
            DatagramPacket packet =
               new DatagramPacket(receiveData, receiveData.length);
            socket.receive(packet);
            String contents = new String(packet.getData());
            publishProgress(contents);
            socket.close();
         } catch (SocketException e) {
             socket.close();
         } catch (SocketTimeoutException e) {
             socket.close();
         } catch (IOException e) {
             socket.close();
         }

         return (Void)null;
      }
     
      @Override
      protected void onProgressUpdate(String... str) {
         Toast.makeText(act, str[0], Toast.LENGTH_SHORT).show();
      }
   }
}
 

Tuesday, November 20, 2012

GPS data from Wifly to Android phone (Part 1)

Once an Access Point has been created on the phone with the app described in the last post, we can use the app’s data to configure the RN-XV module. Let's keep the same example:


            - SSID :                     DIRECT-6U-Android_37e5
            - passphrase :           sK2QIENk           
            - phone’s IP :            192.168.49.1

Here is the arrangement used to configure the RN-XV module:


  Only 4 pins will be used on the RN-XV module:
  • pin 1 (red) : VDD_3V3
  • pin2 (yellow) : UART_TX
  • pin3 (green) : UART_RX, with an external 10k pull-up to 3.3 V
  • pin 10 (black) : GND
The module is connected to a laptop running TeraTerm through a USB-to-Serial converter. Here, we use the Adafruit's USB to TTL Serial Cable. Note that the converter's red wire should NOT be used, as it is connected to the USB 5V power, which could damage or destroy the RN-XV. The TeraTerm monitor software is configured at 9600 baud, which is the default for the RN-XV UART.
 
Once connected, the following commands are sent to the RN-XV module:
 
$$$
factory R
reboot
 
$$$
set wlan ssid DIRECT-6U-Android_37e5
set wlan passphrase sK2QIEnk
save
reboot
 
$$$
set ip host 192.168.49.1
set ip remote 50000
set ip proto 1
set comm time 10000
set comm size 75

set comm match 13
save
reboot
 
With this configuration, the module will form and send a UDP packet from the already received data each time any one of the following conditions occurs:
  • 75 bytes of serial data has been received by the module through the UART_RX pin;
  • or the ASCII character 13 (carriage return) has just been received;
  • or 10 seconds have occured since the last packet has been sent.
In the following arrangement, a GPS NMEA output at 9600 baud is connected to the UART_RX pin, and the RN-XV module continuously forms and sends UDP packets with the GPS data. Each packet will contain a complete NMEA sentence, as these sentences all end with the carriage return byte, and are less than 75 bytes.


Our next step will be to create an Android app for the phone that will capture the packets, retrieve the GPS data and display the info on the screen. 


Sunday, October 14, 2012

Talking to an Android phone through Wi-Fi

In this system, the master controller sends its serial data to a laptop through a USB-to-Serial converter.  The laptop is responsible for creating a number of colorful animated displays from this data. Now I am interested to send this same data to an Android phone that can create its own custom displays. This can be done either through Wi-Fi or Bluetooth.

I want to implement both, by double-splitting the UART Tx line to a RN-XV Wifly Module, and to a BlueSMiRF Bluetooth Modem.


In this post, I will discuss the Wi-Fi route.

The goal is to establish a peer-to-peer adhoc connection between the Wifly module and the phone, and to use UDP packets to keep a low latency in the transmission of live 10 Hz data. Since Android 4.0, it is possible to programmatically configure the phone as an Access Point (AP) visible to nearby Wi-Fi modules (including those integrated in most modern laptops and computers).

There is currently a limitation to this approach (but see UPDATE below!). In creating the AP, the Android system assigns a random SSID and passphrase to it, and it is not possible to edit these values The Wifly module must have an advanced knowledge of these values in order to connect to the phone. So the AP must first be created by the phone, and its details made visible in order to configure the Wifly module.

I have created a simple app tool to assist in this task. It is available on Google Play under the name ‘Wi-Fi P2P Access Point’. I have set up a small fee to refrain people to install it without having a real interest and knowledge of what it is designed for.

With this application, you can create an access point that will live as long as Wi-Fi is enabled on the phone, or until you manually remove it in the app, or until the Android system arbitrarily decides to destroy it to reclaim resources.


Here is a simple way to test if the AP actually exists. After you create an AP, your laptop will automatically list it as an available network, and if you want to connect, you will have to provide the passphrase. Once connected, nothing more happens because there is no data flow on the connection.

Avoid rapidly creating and removing APs without some pause between the commands. The app will become unresponsive and you may have to disable and re-enable Wi-Fi.

In coming posts, as an intermediate step, we will look at:

- how to configure the Wifly module to send GPS data to the phone;

- how to develop a custom app than can display these data.


UPDATE: With Android 4.2.1, the above limitation seems to have disappeared! The SSID and passphrase remain the same when the access point is removed and recreated.


Saturday, June 23, 2012

Compass calibration on the water

Even if an electronic compass has been meticulously calibrated on land in a non-disturbed magnetic environment, it will need additional calibration adjustments once installed in a boat.

In a previous post, I described a procedure to recalibrate a compass with a GPS if you can find a patch of water where there is absolutely no current, a situation that practically does not exist in my maritime environment.

If your system can log the headings from a fast compass (5 Hz or more), here is an alternate method that can tolerate an existing current, but requires absolutely flat water (no waves) and no (or very negligible) wind. This is in fact the method that many commercial compass vendors choose to implement in their autocalibration routines, but presented here in a transparent manner.

These conditions must be met: a low and constant motoring speed (2 to 4 knots), and a tiller or wheel blocked in position so that a complete turn will take around 3 minutes.

Here is how I produced the results presented at the end of this post.

I made several turns while logging the headings (for both the Aimar H2183 and my own Hi-Resolution compass), as well as the boat speed. From the speed log, I find a section where the boat speed has been very stable, and I extract the heading data from a full turn.

We can make the reasonable hypothesis (with no waves and no wind) that our angular velocity has been constant during this golden turn, so that all recorded headings have to be separated by equal angles. If this is not the case, we can calculate the local deviation.

So several turns are recorded, but only the best one is used in the calibration. Here is simplified example using only a reduced set of measurements.


In Colum A, we have the measured headings on a complete turn, with 20 diffferent measurements. The expected angle difference between each measurement is 360/20 = 18 degrees. In Column B, we have calculated these expected headings if there was no deviation. In Column C, we calculate the deviation (A – B).

We can graph these deviations (C) vs. the measured heading (A). This is our deviation graph.


From these data points, we can calculate (using the NLREG software)  the 5 deviation coefficients (A, B, C, D, E) such as that:

Deviation = A + B sin(H) + C cos(H) + D sin(2*H) + E cos(2*H).

By correcting the measured heading by the calculated deviation, we obtain a pre-calibrated heading that still needs a last offset correction.  Our graph is based on the assumption that there is no deviation at our starting heading of 100 deg. But this is not necessarily the case; the zero-deviation point(s) may be at some other heading(s).

This last correction is easy to do, as we need only to compare any pre-calibrated heading value to a known heading. For example if, with the boat aligned along a dock at 78.0 deg, we obtain a pre-calculated heading of 76.5 deg, we will have to add a constant offset of 1.5 deg to all our pre-calibrated headings. (Don't trust your regular magnetic compass for this : it has its own uncorrected deviations).

Final corrected heading  =  Measured heading  - Deviation + Offset


Here are the deviation curves obtained from my 2 compass, using data from the same turn.


Airmar H2183 Compass  (1721 meassurements, doubled 5 Hz samples ):


Hi-Resolution Compass (1737 measurements, 10 Hz samples):


So are we done?

Not really, because be still have to check if this calibration remains valid:
 - when the motor is not running
 - when the boat is heeling.


Getting an accurate magnetic heading is a never ending story.